Tables
In addition to the many types of charts and graphs available in Power BI, it is possible to include raw data in a dashboard or report in the form of a table, as shown in Figure 3-20.
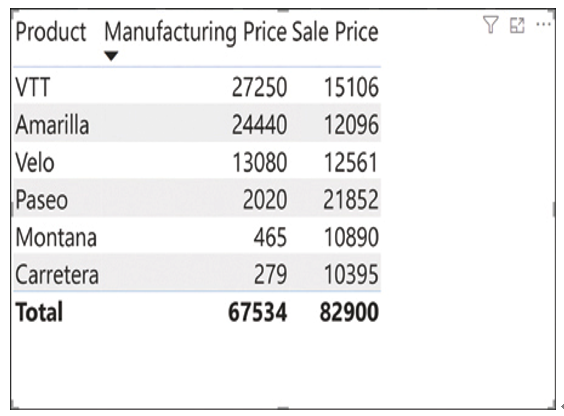
FIGURE 3-20 A table in Power BI
Describe types of filters
Filters are a means by which Power BI designers and consumers can specify what data is displayed in reports (but not in dashboards, which do not support filtering). For example, if a data set contains company financial information for 10 years, the report designer can create a filter that allows consumers to select specific years to be displayed in the report visualizations.
Any means by which data is categorized in a data set can be used as a filter. If a company has five branch locations, as long as the data set specifies a branch office for each data point, the report designer can use that information as a filter that allows consumers to select the branch office(s) to display in a report.
There are four types of filters that designers can create in a report:
■ Report—Applies to all the pages in the report
■ Page—Applies to all the tiles on the current report page
■ Visual—Applies to a single tile on a report page
■ Drillthrough—Provides access to additional detail within a specific tile
Power BI reports support two means of selecting the data displayed in them: slicers and filters, as shown in Figure 3-21. A slicer is a type of visualization that functions as a filtering mechanism consisting of a list of check boxes like those of the Executive slicer shown on the left side of the figure. Consumers can select any combination of check boxes to specify which executives should be represented in the report.
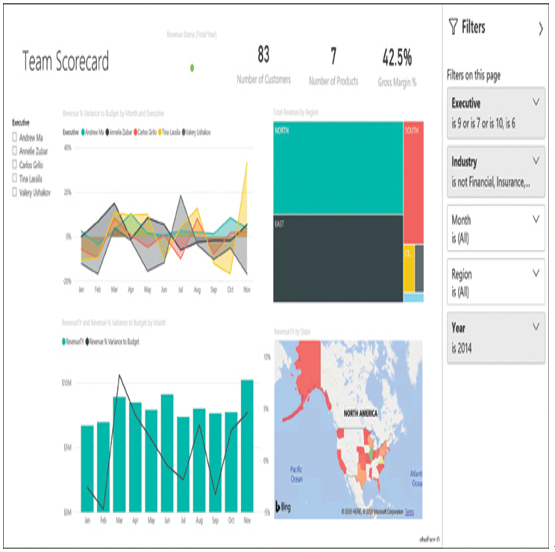
FIGURE 3-21 Slicers and filters in a Power BI report
The Filters pane, on the right side of the figure, contains the filters created by the report designer and the default filter values the designer specified. For example, there is a Year filter for which the designer selected the value 2014 as the default. However, the data set contains data for other years, which the consumer can display by expanding the Year filter, as shown in Figure 3-22, and then selecting any or all of the other Year check boxes.
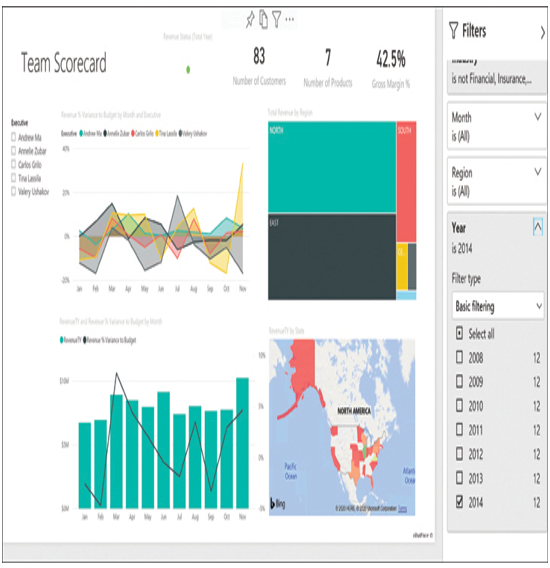
FIGURE 3-22 Power BI report with Year filter expanded
Power BI filters use basic filtering by default, but consumers can switch to an Advanced filtering option, shown in Figure 3-23, which allows the use of Boolean operators to create more complex filter behaviors.

FIGURE 3-23 Power BI report with the Year filter configured to use Advanced filtering
When a consumer modifies the filters to display different information in a report, Power BI saves the changes made in that consumer’s account only. When the consumer opens the same report again, even on another device, the changes appear as they were saved. The consumer can then use the Reset button at the upper right of the workspace to return all the filters to their default settings.
Note Filter Modifications
Consumers can modify the settings of a report’s existing filters for use in the current or future sessions, but they cannot create new filters or delete existing ones. Filter setting modifications apply only to that consumer; they do not modify the appearance of the report to other consumers, and as always with Power BI, they do not modify the original data sources in any way.
In the Editing view used by report designers, the Filters pane contains three sections, as shown in Figure 3-24, which are labeled as follows:
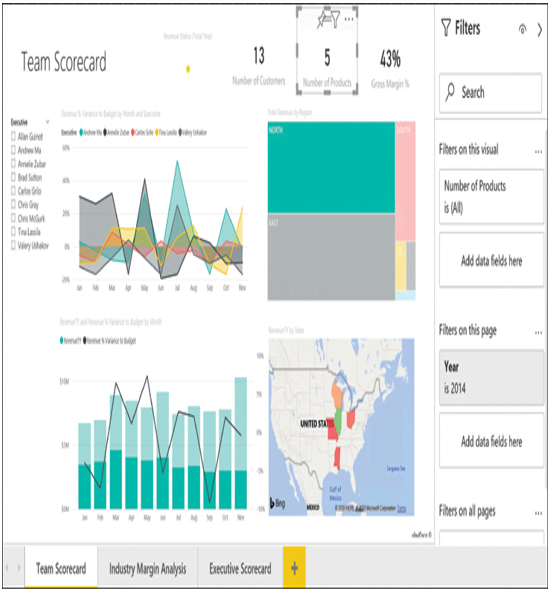
FIGURE 3-24 The Editing view of a Power BI report with the Filters pane
■ Filters on this visual
■ Filters on this page
■ Filters on all pages
The designer can drag data fields from the Fields pane to each section and then configure the filter for each field with the default settings that will appear to consumers.
Exam Tip
Power BI has introduced a new design for the Filters pane as of April 2020. Newly created dashboards and reports use the new design automatically. Existing dashboards and reports appear with the old design, in which the Filters controls appear in the Visualizations pane and provide the designer with the opportunity to upgrade to the new design. In the new design, a separate Filters pane adds new functionality, including the ability to format the Filters pane to match the report, hide all or part of the Filters pane from consumers, and lock specific filters so that consumers cannot modify them.