Removing rows and columns
When combining data from different sources, it is common for developers not to need everything that Power BI Desktop obtains from each source. For example, the Ranking of best and worst states for retirement webpage accessed in the previous section includes a column containing the names of the states. However, a developer might want to use the two-letter state abbreviations instead. To do this, the developer can access another data source that contains columns specifying the state names and their abbreviations. However, that data source might include other information as well.
For example, the data source shown in Figure 3-44 includes a column containing the full names of the states, as well as one containing the equivalent ANSI values, which are the standard two-letter state abbreviations. However, there are 11 columns in total, of which the developer needs only two. It is therefore possible to select the unneeded columns and select Manage Columns > Remove Columns in the ribbon to delete them.
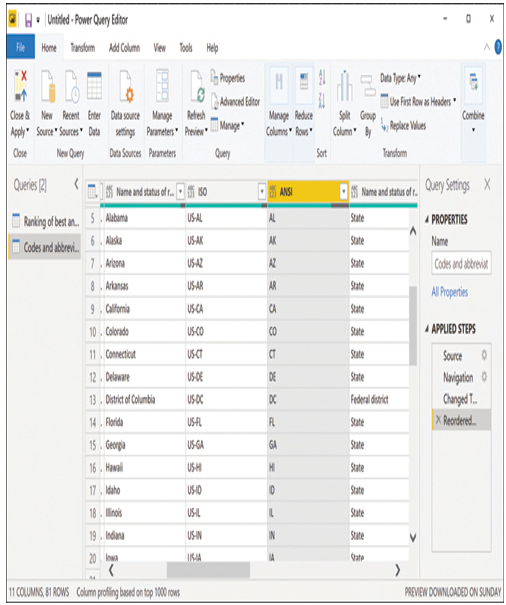
FIGURE 3-44 State abbreviations in a second data source
Renaming elements
Depending on the configuration of the data as it appeared in the source, it might be necessary for a developer to click the Use first row as headers command in the ribbon’s Transform group to create column headers. It is also possible for the developer to right-click a column and rename the header to accommodate the needs of the other source to which the developer will merge or append the data.
Combining queries
Modeling data is essentially a matter of applying one or more queries to it. Power BI Desktop therefore refers to the modeled data from a source as a query. After the developer has modeled the data from multiple sources, it is possible to combine the queries in two ways:
■ Merge—Adds columns from one data source to the existing columns from another source
■ Append—Adds new rows from one data source to the existing rows in another source
In the previous example, the developer sought to add the state abbreviations to the Ranking of best and worst states for retirement data. To do this, the developer selects the target data source and, on the ribbon, selects Combine > Merge Queries.
In the Merge dialog box, shown in Figure 3-45, the developer selects the query to be merged and the columns to be matched during the process. In this example, selecting the State and State Name columns will synchronize the state abbreviations with the correct names.
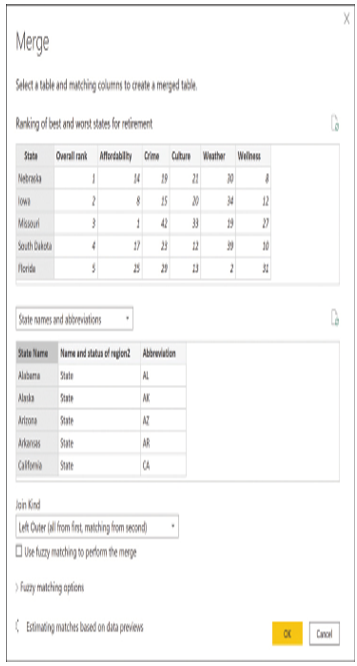
FIGURE 3-45 The Merge dialog box in Power BI Desktop
Clicking OK in the Merge dialog box causes the merged data to appear in the original source, as shown in Figure 3-46. The entire merged query appears as a single column with the word “table” in each cell, indicating that column contains all the merged columns in contracted form.
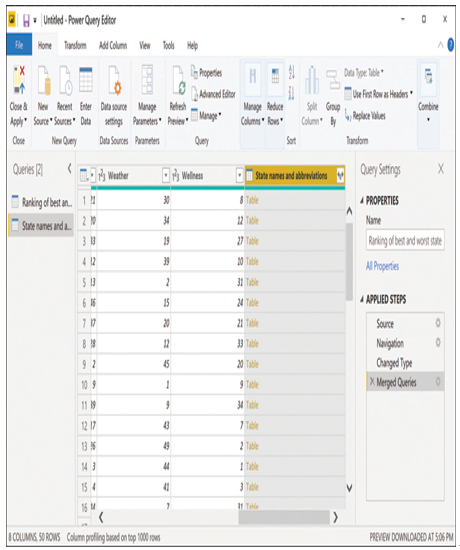
FIGURE 3-46 Power Query Editor with merged query
Clicking the Expand button at the right side of the column header displays the dialog box shown in Figure 3-47. By selecting or clearing check boxes, the developer can specify which expanded columns should appear in the merged query.
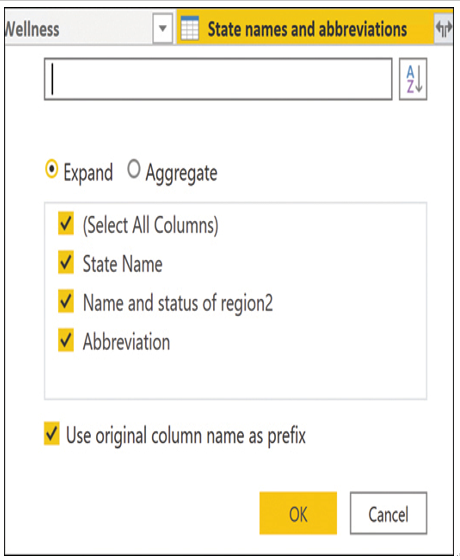
FIGURE 3-47 Expand dialog box in Power Query Editor
For this example, the developer should clear all but the Abbreviation check box and then click OK. The Abbreviation column is now merged into the Ranking of best and worst states for retirement query, as shown in Figure 3-48.
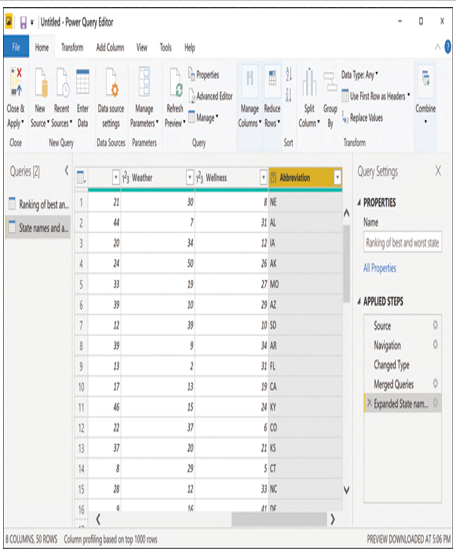
FIGURE 3-48 Power Query Editor with expanded merged query
When the data modeling process is complete, clicking Close & Apply in the ribbon’s Close group adds the table from the Power Query Editor to the report in Power BI Desktop.