Describe uses for custom visuals including charts or controls
Power BI includes a large selection of visualizations, but it is also possible for organizations and users to create their own custom visualizations and share them within the organization or with the outside Power BI community. Custom visualizations can be cosmetic variants on the appearance of built-in Power BI visualizations, such as the addition of a company name or logo, or they can fulfill data display or integration requirements that are specific to the organization. In the Power BI service interface, selecting Get more visuals in the Visualizations pane provides access to the Power BI Visuals screen, as shown in Figure 3-28.
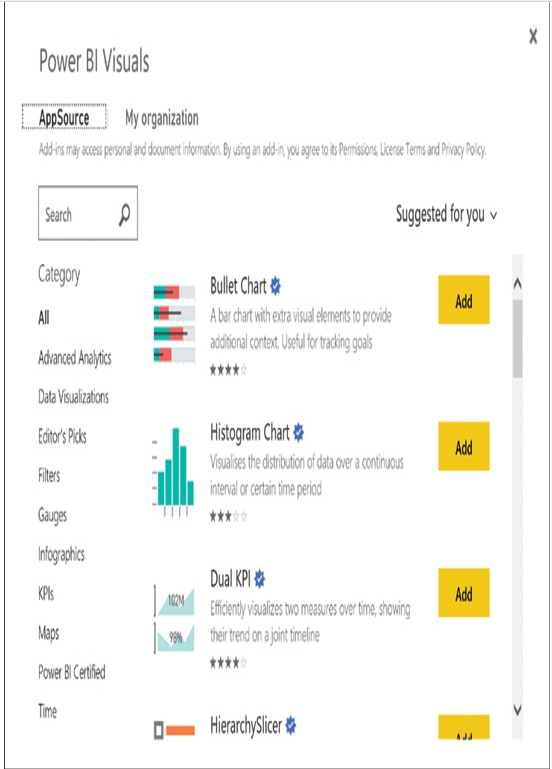
FIGURE 3-28 The Power BI Visuals screen
Note Custom Visuals in Power BI Desktop
In Power BI Desktop, the Get more visuals icon is labeled Import a custom visual.
The Power BI visuals screen has two tabs:
■ AppSource—Contains Power BI visuals available from the Microsoft AppSource store for business applications
■ My organization—Contains custom Power BI visuals uploaded by the organization’s administrators
The AppSource store contains hundreds of Power BI visualizations, including variations on the chart types included in Power BI as well as new chart types and controls for visualizing data, as shown in Figure 3-29.
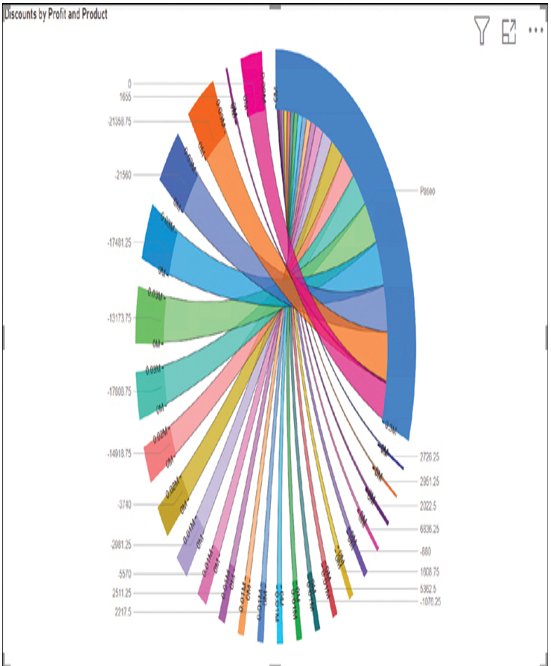
FIGURE 3-29 Chord chart
The My organization tab contains visuals that are exclusive to the organization, such as those that contain company branding or other product-specific features. Before users can access them, visuals on this tab must be uploaded to the service by a Power BI administrator using the Add Visual dialog box in the Power BI admin portal, as shown in Figure 3-30.
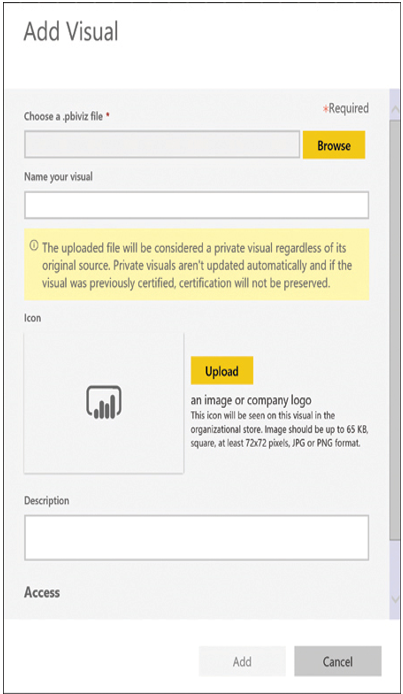
FIGURE 3-30 The Add Visual dialog box in the Power BI admin portal
Creating custom visuals is somewhat more complicated than creating Power BI reports and dashboards and can require some coding. Microsoft has made the code for their visuals and the necessary development tools freely available on its GitHub repository site. To create a custom visual, the developer must set up the correct environment by installing the Node.js tool and the pbiviz package and then by creating a certificate. Then, the developer uses the pbiviz tool to create a custom visual project.
Need More Review? Creating Custom Visuals
For more information on the process of creating custom visuals for Power BI, see https://docs.microsoft.com/en-us/power-bi/developer/visuals/custom-visual-develop-tutorial. After completing the development process, the result is a file with a .pbiviz extension that an administrator can add to the My organization tab. It is also possible to submit a custom visual to the AppSource site for distribution on the internet. An optional part of this process is for Microsoft to certify the custom visual to make sure that its code is secure and that it does not access any external resources, such as commercial libraries or outside services.