Skill 3.2: Connect to and consume data
The first step in creating Power BI content is to access the data that the developer intends to illustrate using the charts and other types of visualizations that Power BI provides. Doing so calls for the developer to establish a connection to any of the data sources that Power BI supports and to select specific data provided by that source. Power BI Desktop allows developers to connect to multiple data sources and model the data into the form needed to tell an appropriate story in the Power BI report.
This skill covers how to:
■ Combine multiple data sources
■ Describe and implement aggregate functions
■ Identify available types of data sources including Microsoft Excel
■ Describe use cases for shared data sets and template apps and how to consume each
Combine multiple data sources
The Power BI service allows developers to connect to any one of hundreds of data sources. However, in Power BI Desktop, it is possible to connect to multiple data sources at once and combine the information from them into a single data model.
As noted earlier in this chapter, connecting to a data source is the first step in creating a Power BI report. When you create a new file in Power BI Desktop, the startup screen includes a Get data button that starts the process of connecting to a data source by displaying the Get Data screen shown in Figure 3-38.
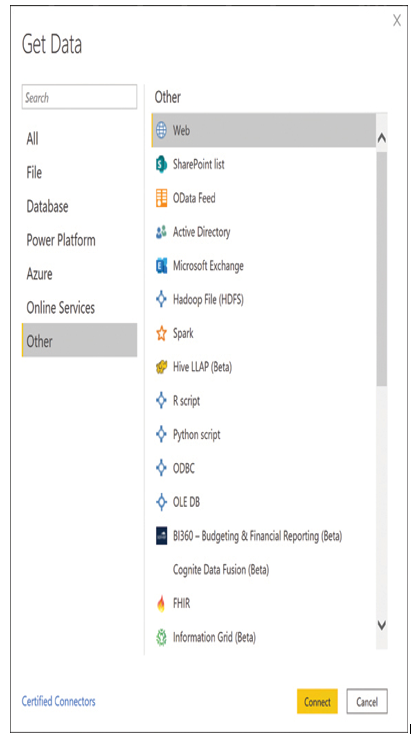
FIGURE 3-38 The Get Data screen in Power BI Desktop
The developer can choose from hundreds of data sources, which generate proper screens for the submission of credentials. For example, to access data on a webpage, Power BI Desktop generates an Access Web content dialog box, as shown in Figure 3-39. Here, the developer can choose to access the webpage anonymously or specify one of the standard web authentication protocols.
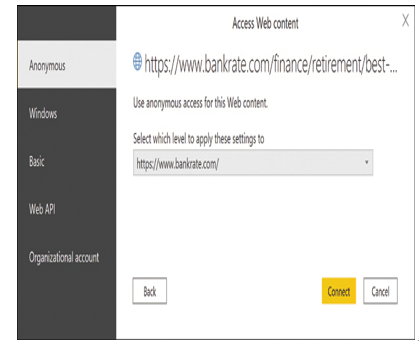
FIGURE 3-39 The Access Web content screen from Power BI Desktop
After the developer has authenticated to the data source (if necessary), Power BI Desktop evaluates the data found at the source and displays the Navigator screen, as shown in Figure 3-40, containing all the tables it has found. Selecting a table and clicking Load adds the data to the Fields pane in the Report view.

FIGURE 3-40 The Navigator screen in Power BI Desktop
At this point, the developer can repeat the process to access one or more additional sources and add them to the Report view. In the Home tab in Power BI Desktop, the developer can select one of the icons in the Data group or select Transform data to open the Power Query Editor tool and select New Source.
Once the developer combines the queries, the data from the additional sources is added to the Fields pane, as shown in Figure 3-41. The developer can then proceed to use the data from the various sources to create visualizations for the report, but it is more likely that the data will require some modeling first. Developers do this using the Power Query Editor tool in Power BI Desktop.
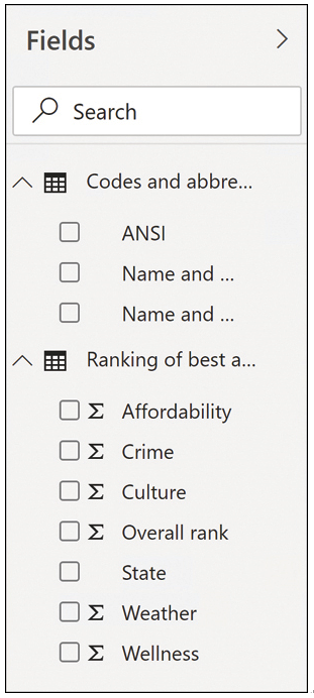
FIGURE 3-41 The Fields pane in Power BI Desktop with two data sources