Skill 3.3: Build a basic dashboard using Power BI
A dashboard is a single-page Power BI document, like the one shown in Figure 3-61, that presents consumers with a selection of tiles containing highlights from one or more reports. The object of a dashboard is to tell a story relatively concisely, in relation to a report. It is assumed that if the consumers require more information, they can simply look at the report(s) from which the dashboard tiles came.
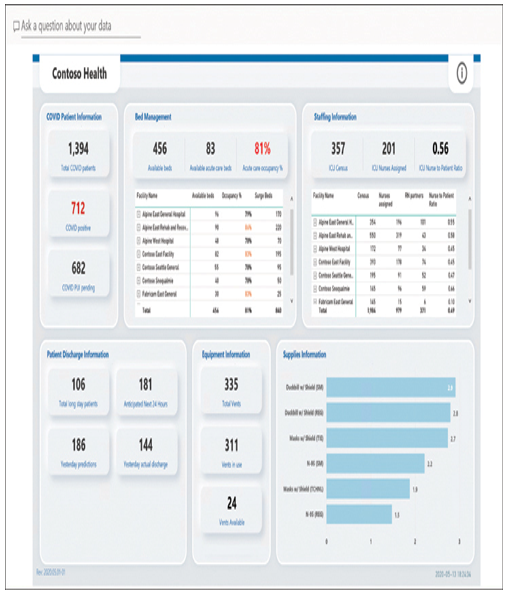
FIGURE 3-61 Sample Power BI dashboard
This skill covers how to:
■ Design data layout and mapping
■ Publish and share reports and dashboards
Design a Power BI dashboard
A dashboard is a single page composed of tiles, rectangular placeholders containing visualizations taken from existing reports and data sets that update in real time. Dashboards are essentially gateways to the reports and data sets from which the tiles are taken. When consumers click a tile on a dashboard, they are taken to the report that is the source for the tile.
There are advantages to creating dashboards, rather than having consumers just access the reports from which they were sourced themselves. A dashboard is a single page, whereas a report can have many pages. Therefore, a well-designed dashboard contains only the information that is essential to the story that the developer wants to tell. Dashboards can also take their tiles from multiple dashboards and data sets. This allows a developer to use resources from several places to create a composite picture of a situation or process.
Although developers can create reports and data sets in either the Power BI service or Power BI Desktop, they can only create dashboards in the Power BI service. Therefore, any reports and data sets created and saved in Power BI Desktop must be published to the service before developers can use elements from them in dashboards.
The process of creating a dashboard begins with the creation of a report by connecting to a data source, modeling the data, and creating visualizations. There are then several ways to create a dashboard, but the simplest is to pin visualizations from the report to a new, empty dashboard, as in the following procedure.
Open a report in the Power BI service in Edit view and select a visualization. A toolbar appears in the upper-right corner, as shown in Figure 3-62.
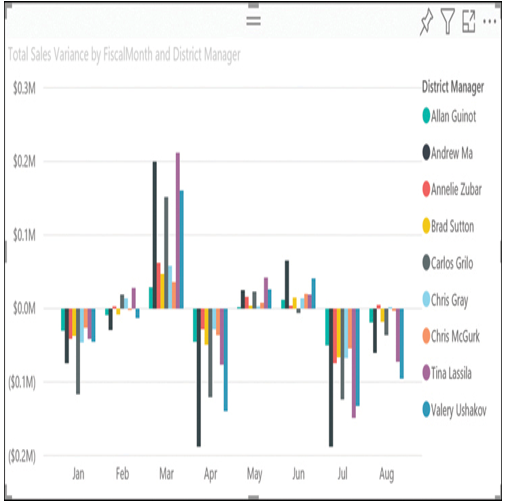
FIGURE 3-62 A Power BI report visualization with toolbar
Click the Push pin icon in the toolbar to open the Pin to dashboard dialog box, as shown in Figure 3-63.
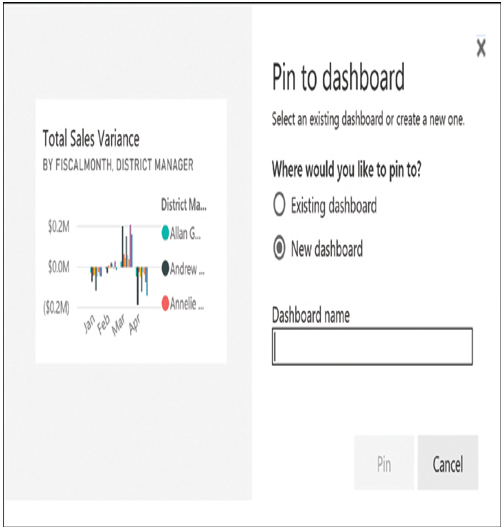
FIGURE 3-63 The Power BI Pin to dashboard dialog box
Select the New dashboard radio button, specify a name in the Dashboard name field, and click Pin. The new dashboard is created in the default workspace, and a Pinned to dashboard message appears.
Click Go to dashboard. The newly created dashboard appears with the selected visualization on it, as shown in Figure 3-64.
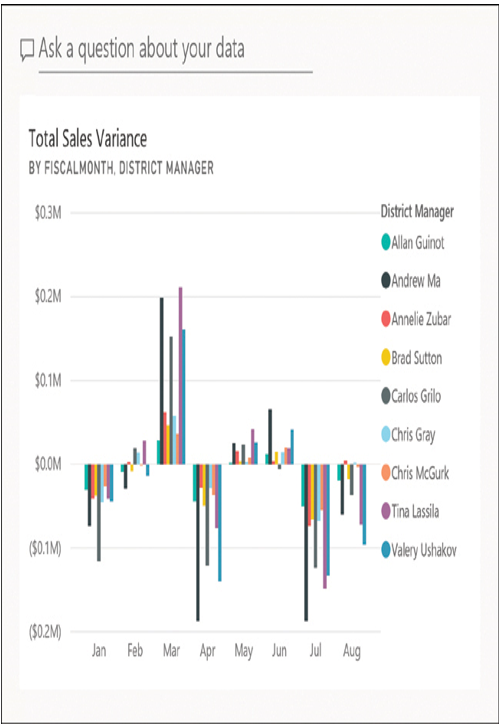
FIGURE 3-64 A newly created dashboard with a single visualization
After Power BI has created the new dashboard, the developer can pin additional visualizations to it, this time selecting the Existing dashboard option in the Pin to dashboard dialog box. The additional visualizations can come from the same report as the first one or from different reports.
Note Creating a Live Page
If a developer wants to create a dashboard that consists of an entire page from a report, it is possible to do so without pinning each visualization individually by clicking the More options button on the page’s toolbar and selecting Pin a live Page from the context menu to generate a Pin to dashboard dialog box like the one shown earlier.
It is also possible to add tiles containing media content and other material directly to a dashboard by selecting Add tile from the More Options menu to display the Add tile dialog box shown in Figure 3-65.
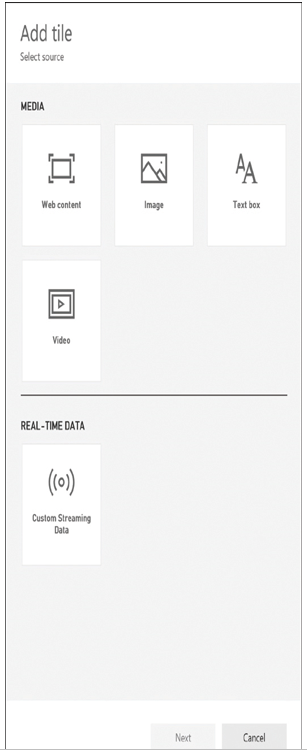
FIGURE 3-65 The dashboard Add tile dialog box in the Power BI service